Webserver
The sensor hosts its own webserver which can be used to check the status of the sensor, update the firmware and configure the sensor.
The webserver is only available if the sensor is connected to WiFi.
To access the webserver, open a browser and navigate to the http://[sensor address].local or http://[sensor IP].
You can get info on finding either here.
By default, http://materialsensor.local should work, if not, make sure the device name is the same or fall back to using the sensor IP address (for example http://192.168.1.10).
Make sure the address starts with http:// not https://.
Once the browser has loaded the webserver, it will try to open a websocket connection, please wait a few seconds, after which the webserver should be fully loaded.
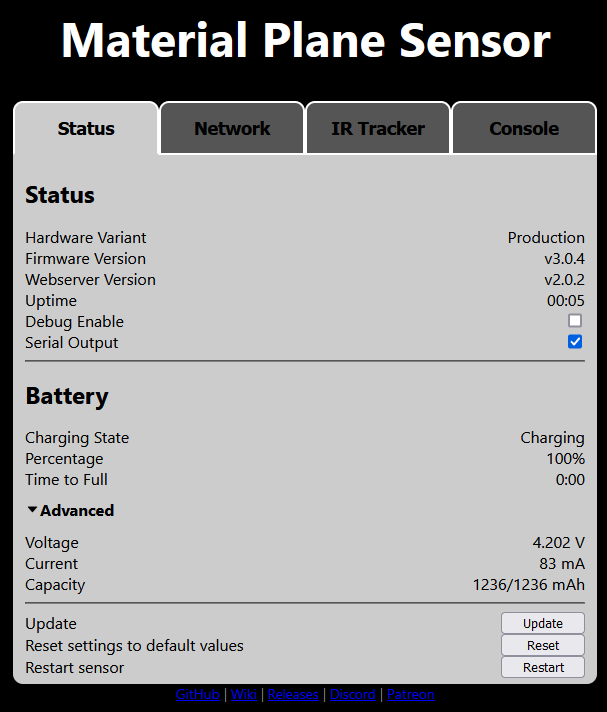
Status Tab
The status tab gives an overview of the sensor status, allows the firmware to be updated, the sensor to be reset to its default values, and the sensor to be restarted.
Status
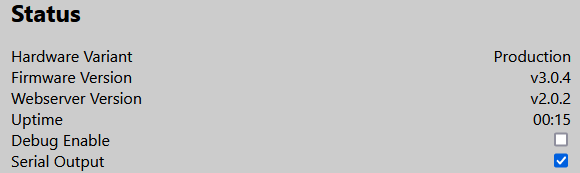
- Hardware Variant: The hardware variant of the sensor (for example 'Production' or 'DIY Basic').
- Firmware Version: The current version of the firmware.
- Webserver Version: The current version of the webserver.
- Uptime: The time in hours and minutes the sensor has been on.
- Debug Enable: If enabled, the sensor will output debug data to the console or the USB port.
- Serial Output: If enabled, the sensor will output data over the USB port.
Battery
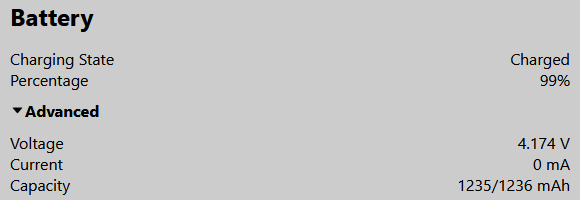
- Charging State: The current charging state.
-
Percentage: The estimated remaining battery percentage.
-
Time to Empty: Estimated time in hours and minutes until the battery is empty, see below.
- Time to Full: Estimated time in hours and minutes until the battery is full, see below.
Battery (Advanced)
There is an advanced battery section that can be expanded by clicking on it.
- Voltage: The battery voltage.
- Current: Current drain of the battery (negative means battery draining, positive means the battery is charging).
- Capacity: Estimated battery capacity (current/maximum).
Time to Empty/Full
The sensor can give an estimated time to empty or time to full.
Please note that these values can be way off. The sensor will slowly learn the battery behavior which will improve the estimate, however, when the sensor has just started up, the sensor just started or stopped charging, or when the battery configuration has just been reset (see below), the values will be inaccurate.
Lower section
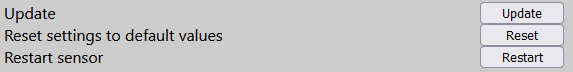
- Update: Opens a new window to update the sensor. See here for more info.
- Reset Settings to Default Values: Opens a new window to reset some or all of the sensor settings. See below for more info.
- Restart Sensor: Restarts the sensor.
Resetting Sensor Settings
Pressing the 'Reset' button will open a new popup where you can reset sensor settings back to their defaults.
You can choose one or more of the following:
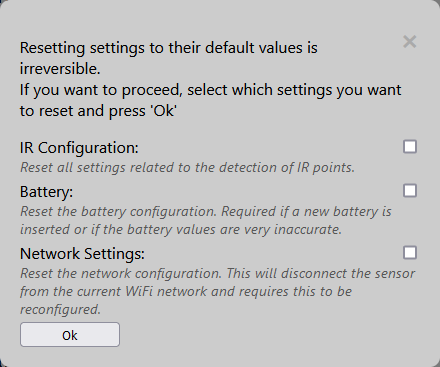
- IR Configuration: If ticked, will reset all settings related to the detection of IR points (everything configurable in the 'IR Tracker' tab).
- Battery: If ticked, will reset the battery configuration. The sensor will learn the battery behavior over time to make more accurate estimates. If the battery configuration is reset, it will clear this stored behavior. This is required if a new battery is inserted or if the battery values are very inaccurate.
- Network Settings: If ticked, will reset all settings related to the network, such as the network to connect to. This will disconnect the sensor from the current WiFI network and requires this to be reconfigured.
By pressing 'Ok' the ticked configurations will be reset and the sensor will restart.
Network Tab
Network Status
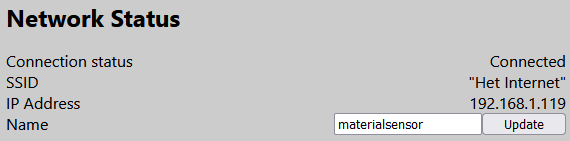
- Connection Status: Indicates if the sensor is connected to a WiFi network.
- SSID: The network the sensor is connected to, or configured to connect to.
- IP Address: The IP address of the sensor.
- Name: The name of the sensor.
Access Points
Here you can scan for and connect to a WiFi network.
Follow the instructions (starting from #4) here.
Websocket
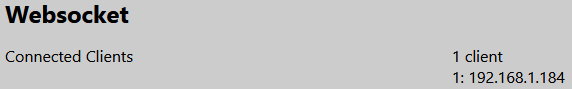
Status of the websocket server that the sensor hosts.
It displays how many clients are connected and their IP addresses. These could be from browsers accessing the webserver or from VTT clients.
IR Tracker Tab
This tab is used to configure the sensor settings.
Console Tab
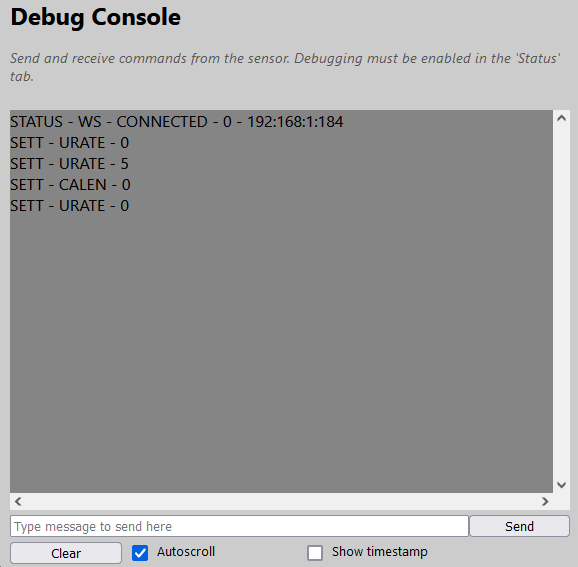 The console tab is meant for debugging. If 'debug enable' is ticked in the status tab, the sensor will send debug messages to the console.
Messages can be sent to the sensor at the bottom, the 'Clear' button clears the console, 'Autoscroll' enabled or disables the automatic scrolling, and 'Show timestamp' will prepend each message with the time it was received.